Instructional Designer Salary Report 2024
By Devlin Peck · Updated
Part of the Become an Instructional Designer guide
What is the average instructional design salary?
One of the most common questions that people ask when they consider instructional design as a profession is:
How much money do instructional designers make?
Today, you'll learn what the average instructional designer salary is in the US and worldwide.
Want to learn more? Read on!
Average instructional designer salary in the US
The average instructional designer salary across all industries and types of employment in the US is $83,347. For instructional design corporate roles, the average salary is $85,452.
Top instructional designer salary statistics
Based on a survey we conducted and that got responses from 1075 instructional designers across the world, here’s some of the top salary insights:
- The average instructional designer salary in the US is $83,347
- The average instructional designer salary for full-time corporate roles in the US is $85,452
- The average self-employed instructional designer salary in the US is $84,796
- The average instructional designer salary in Canada is $79,700 CAD
- In the UK, the average salary is £38,665 GBP
- And in Australia, the figure is $117,004 AUD
- US-based instructional designers with 0-3 years of experience saw an 8% increase in salary over the past three years
- Instructional designers with 0-3 years of experience earn about $2,000 more with a portfolio than without a portfolio.
- Full-time corporate instructional designers earn almost 25% more than those in higher education.
Note: You are welcome to discuss these results in your own content, but please link back to this report if you do so.
This data has been updated in December 2023 based on data from the 2024 instructional design industry survey. We’ll continue to update the data on this page as we conduct new industry surveys.
To see the numbers that actually apply to you, use the explorer below: pick your country, experience level, and sector, and I'll show you where you sit against the survey data.
Interactive tool
See where you sit
Pick your profile and I'll show you the matching averages from my salary survey data, plus what I'd read into each number. Everything below comes from the 1,075 valid responses to the survey; nothing is modeled or projected.
Country
| Group | Average | Respondents |
|---|---|---|
| United States | $83,347 | 518 |
| Australia | 117,004 AUD ($74,374) | 21 |
| Canada | 81,607 CAD ($63,726) | 39 |
| United Kingdom | 39,018 GBP ($52,855) | 25 |
| India | 1,184,596 INR ($14,213) | 52 |
- These are full-time employee averages from Devlin Peck's ID salary survey data, converted to USD in December 2023.
- The US sample (518 full-time respondents) is the only one deep enough to slice further, which is why the other cuts below are US-only.
- Only countries with more than 10 respondents are listed. If yours is missing, the survey did not have enough data to say anything honest about it.
Years of experience
| Group | Average | Respondents |
|---|---|---|
| 0 to 3 years | $77,856 | 308 |
| 4 to 8 years | $87,809 | 135 |
| 9 to 15 years | $93,046 | 47 |
| 16 to 20 years | $108,214 | 14 |
| 21 to 25 years | $109,750 | 8 |
| 26+ years | $95,583 | 6 |
- Experience is the strongest earning indicator in Devlin Peck's ID salary survey data, stronger than education or credentials.
- Entry-level pay is rising: respondents with 0 to 3 years saw a 7.8% salary increase compared to the 2021 survey.
- Past 16 years the sample gets small (n=14 and under), so I would not read much into the dip at 26+ years.
Sector
| Group | Average | Respondents |
|---|---|---|
| Corporate | $87,384 | 304 |
| Government | $84,095 | 63 |
| Healthcare | $83,092 | 58 |
| Non-profit | $76,335 | 49 |
| Higher education | $68,474 | 44 |
- Corporate instructional designers are the highest earners, almost 25% ahead of higher education, according to Devlin Peck's ID salary survey data.
- Government and healthcare pay closer to corporate than most people expect.
- The survey did not break out K-12 as its own sector, so I can't give you an honest K-12 number here.
Employment type
| Group | Average | Respondents |
|---|---|---|
| Full-time employee | $83,347 | 518 |
| Self-employed / freelance | $84,796 | 63 |
| All respondents (total compensation) | $86,686 | 667 |
- Self-employed IDs in the US average slightly more than full-time employees in Devlin Peck's ID salary survey data, with far more spread in both directions.
- Employment is still the norm: 79.4% of respondents are employed by an organization, and about 10.5% freelance on top of a full-time job.
- Freelance earnings worldwide ranged from $10,000 to $325,000 a year, so the average hides enormous variance.
Education level
| Group | Average | Respondents |
|---|---|---|
| Bachelor's degree | $85,044 | 122 |
| Master's degree | $83,812 | 352 |
| Doctorate degree | $93,537 | 29 |
- Education doesn't appear to have a large impact on earning potential: bachelor's holders average slightly more than master's holders in Devlin Peck's ID salary survey data.
- Respondents with a portfolio and a bachelor's degree ($86,433) out-earn respondents with a master's and no portfolio ($86,320), which says a lot about where to invest your time.
- 92% of US respondents hold a bachelor's or master's, so the smaller education categories are too thin to compare fairly.
Portfolio (0 to 3 years, corporate)
| Group | Average | Respondents |
|---|---|---|
| With a portfolio | $83,336 | 123 |
| Without a portfolio | $77,708 | 54 |
- Among new corporate IDs (0 to 3 years), those with a portfolio earn about 7% more than those without, per Devlin Peck's ID salary survey data.
- Across all experience levels the portfolio gap disappears, but that's because veterans skip portfolios and out-earn on tenure. Early on, the portfolio matters.
Before you quote these numbers
- Full-time US salaries in the survey ranged from $35,000 to $300,000, so any average sits on a very wide spread.
- All figures are self-reported and the survey was distributed mainly on LinkedIn, which likely skews the sample slightly high.
- The survey ran from July to September 2023 with 1,075 valid responses; figures were last updated in December 2023.
- The survey did not break salaries down by US region or by remote vs on-site work, so I can't show you those cuts.
How do instructional designers make money?
Instructional designers can work as employees, freelancers, or consultants. As an employee, you earn a salary. As a freelancer or consultant, you typically charge by the project or by the hour.
According to our ID Industry survey, 79.4% of instructional designers are employed by an organization, whereas 10% are freelancers or contractors. 10.5% work as both full-time employees and freelancers.
In other words, instructional designers can make money in different ways, but earning a salary is the most common way.
What is the instructional design salary range?
The salary level of instructional designers varies from country to country. And the differences within a country can be equally broad.
The worldwide salary range for instructional designers who are full-time employees is 540 USD on the low end and 300,000 USD on the high end. In the United States, the respondents’ full-time salaries range from 35,000 USD to 300,000 USD.
Self-employed instructional designers worldwide yearly earnings range from 10,000 USD to 325,000 USD.
What is the average instructional designer salary?
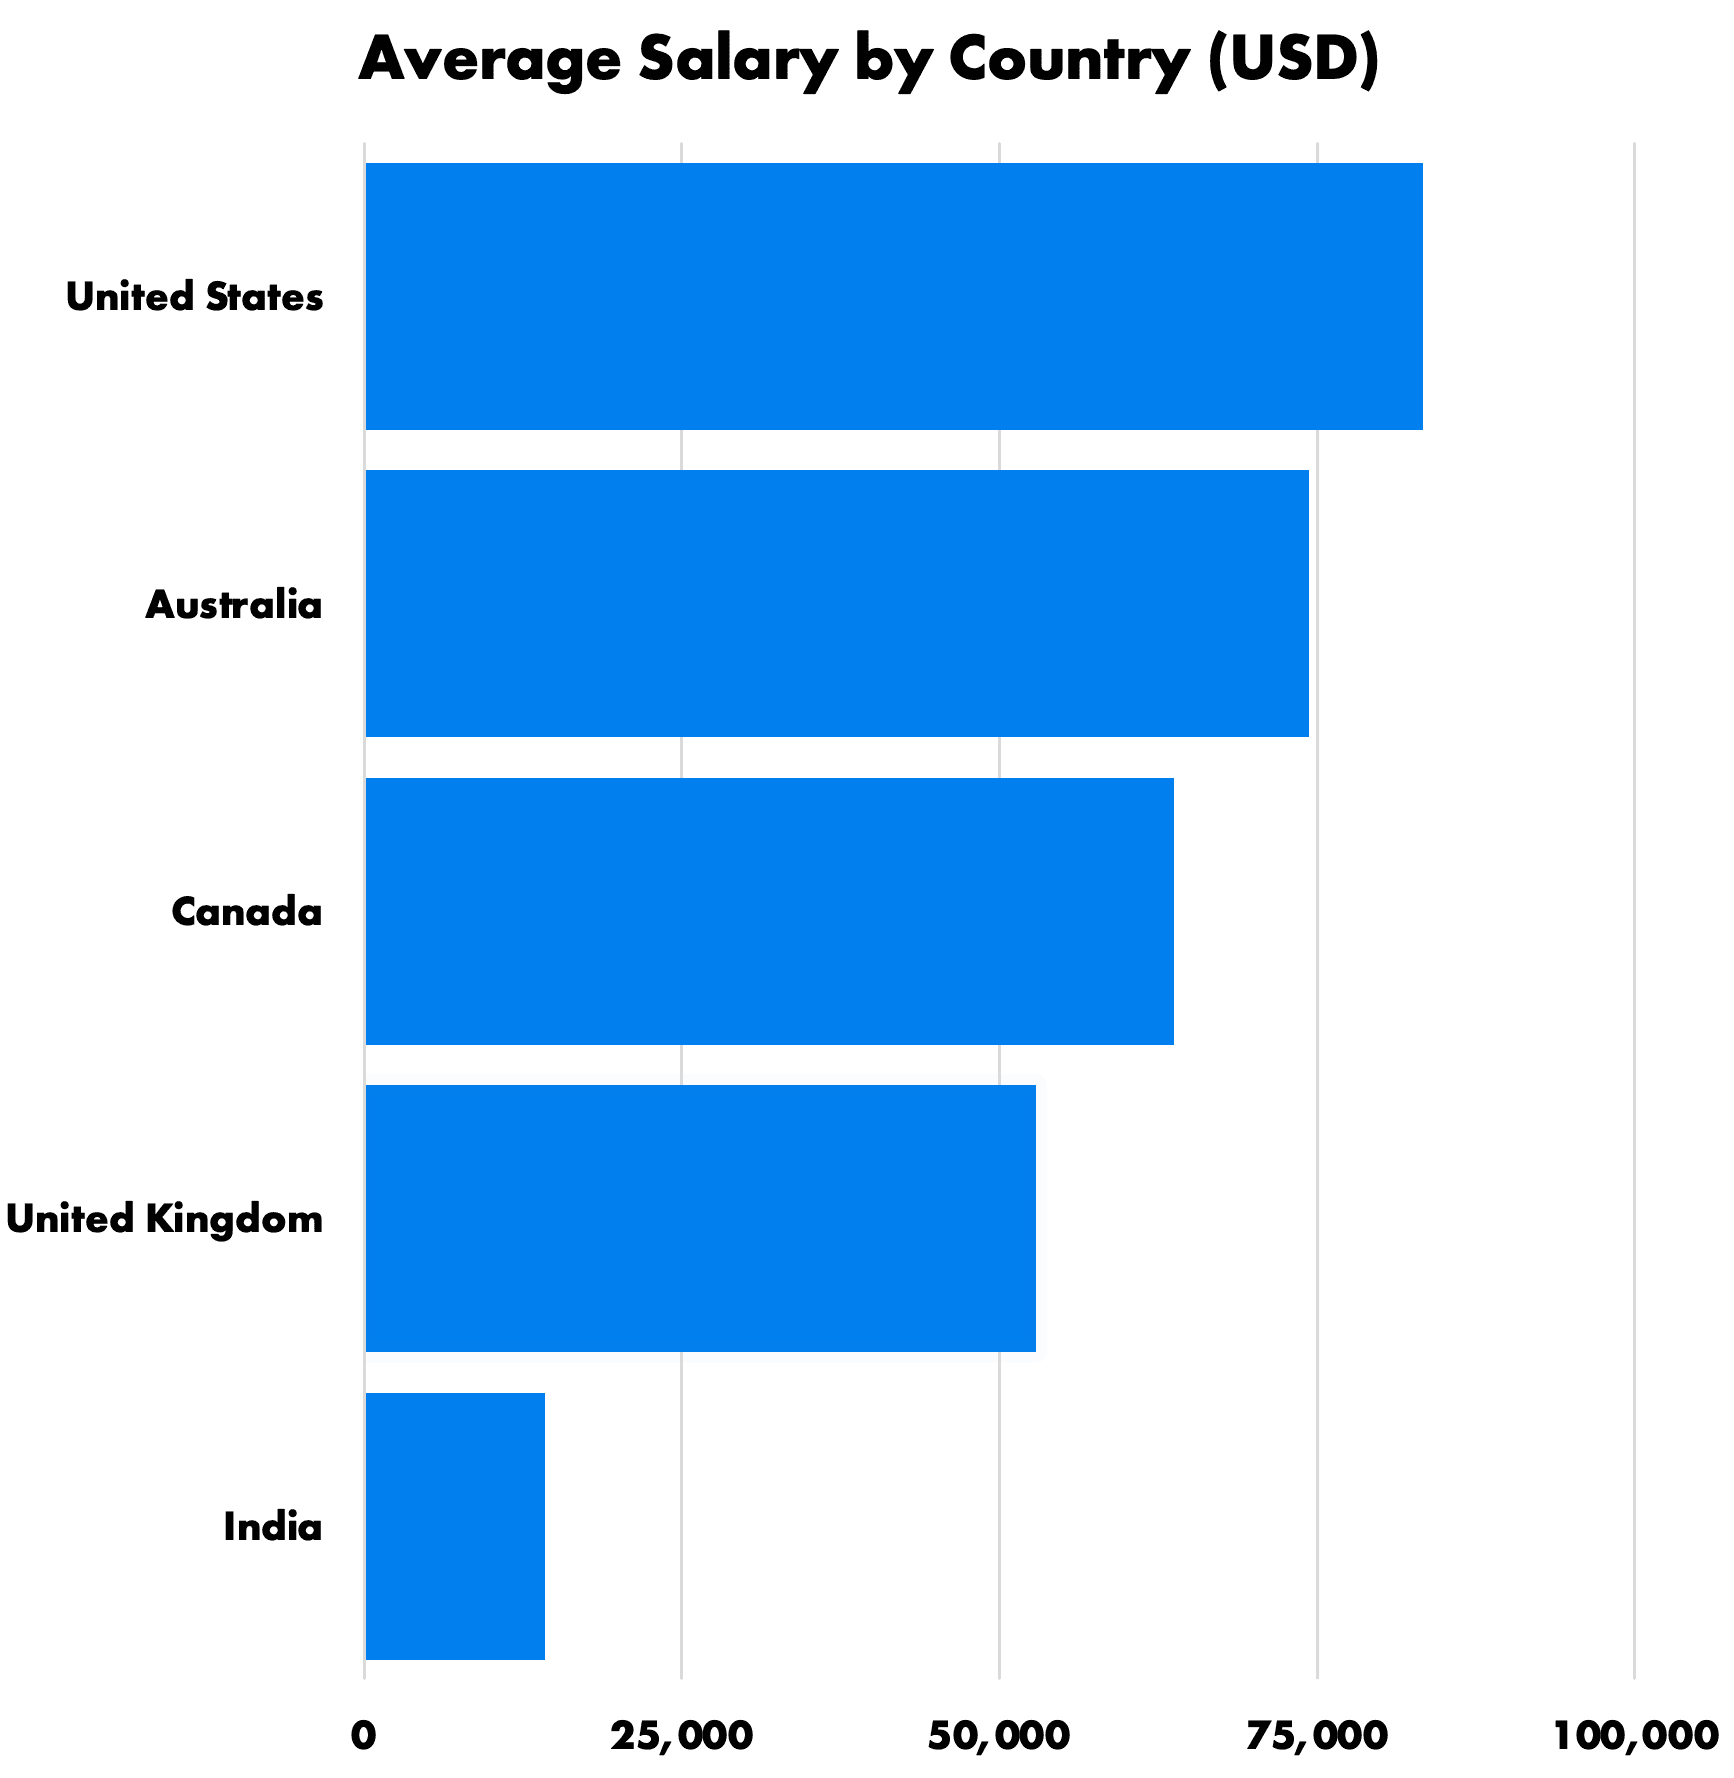
The average full-time employee salaries for the countries with more than 10 respondents are as follows:
- United States - 83,347 USD (n=518)
- Australia - 117,004 AUD (74,374 USD, n=21)
- Canada - 81,607 CAD (63,726 USD, n=39)
- United Kingdom - 39,018 GBP (52,855 USD, n=25)
- India - 1,184,596 INR (14,213 USD, n=52)
“N” refers to the number of respondents in a given category. Currency conversations were completed on December 11th, 2023.
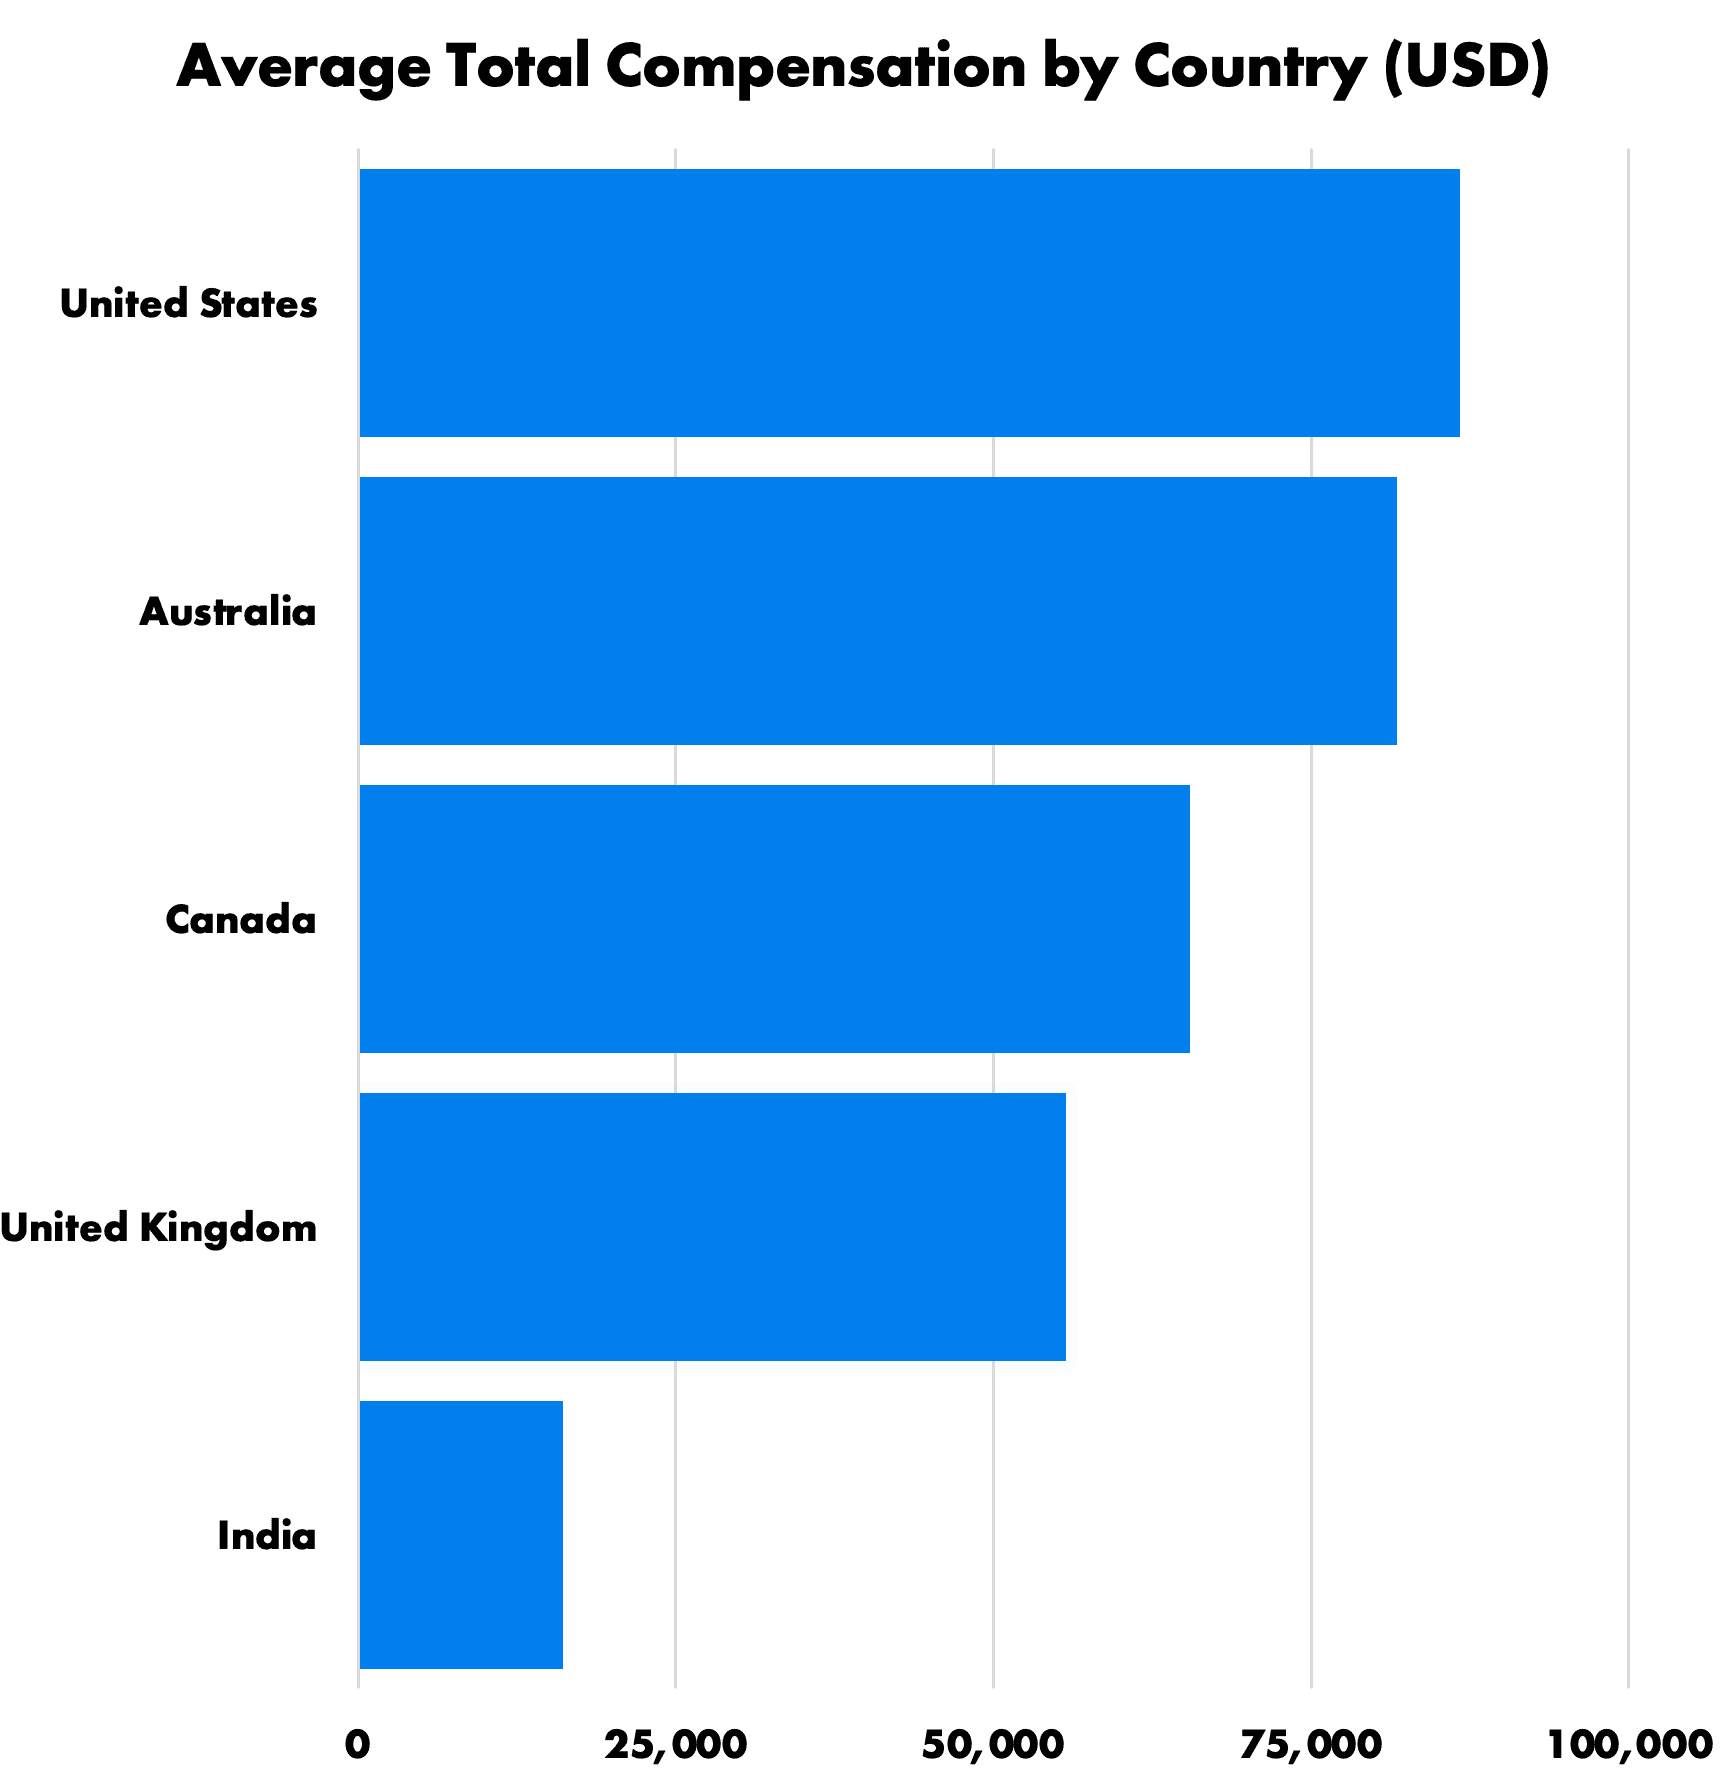
If we look at total compensation (full-time salary + self-employed income), then we see the combined average earnings of people who are employed full-time, self-employed, or both:
- United States - 86,686 USD (n=667)
- Australia - 124,484 AUD (81,738 USD, n=25)
- Canada - 88,869 CAD (65,476 USD, n=54)
- United Kingdom - 44,387 GBP (55,730 USD, n=33)
- India - 1345312 INR (16,142 USD, n=82)
Average Instructional Design Salary in the USA
Since nearly 700 respondents in the United States completed the survey (and 604 of them are full-time employees), we can analyze the US data even further. All dollar amounts in this section are in USD.
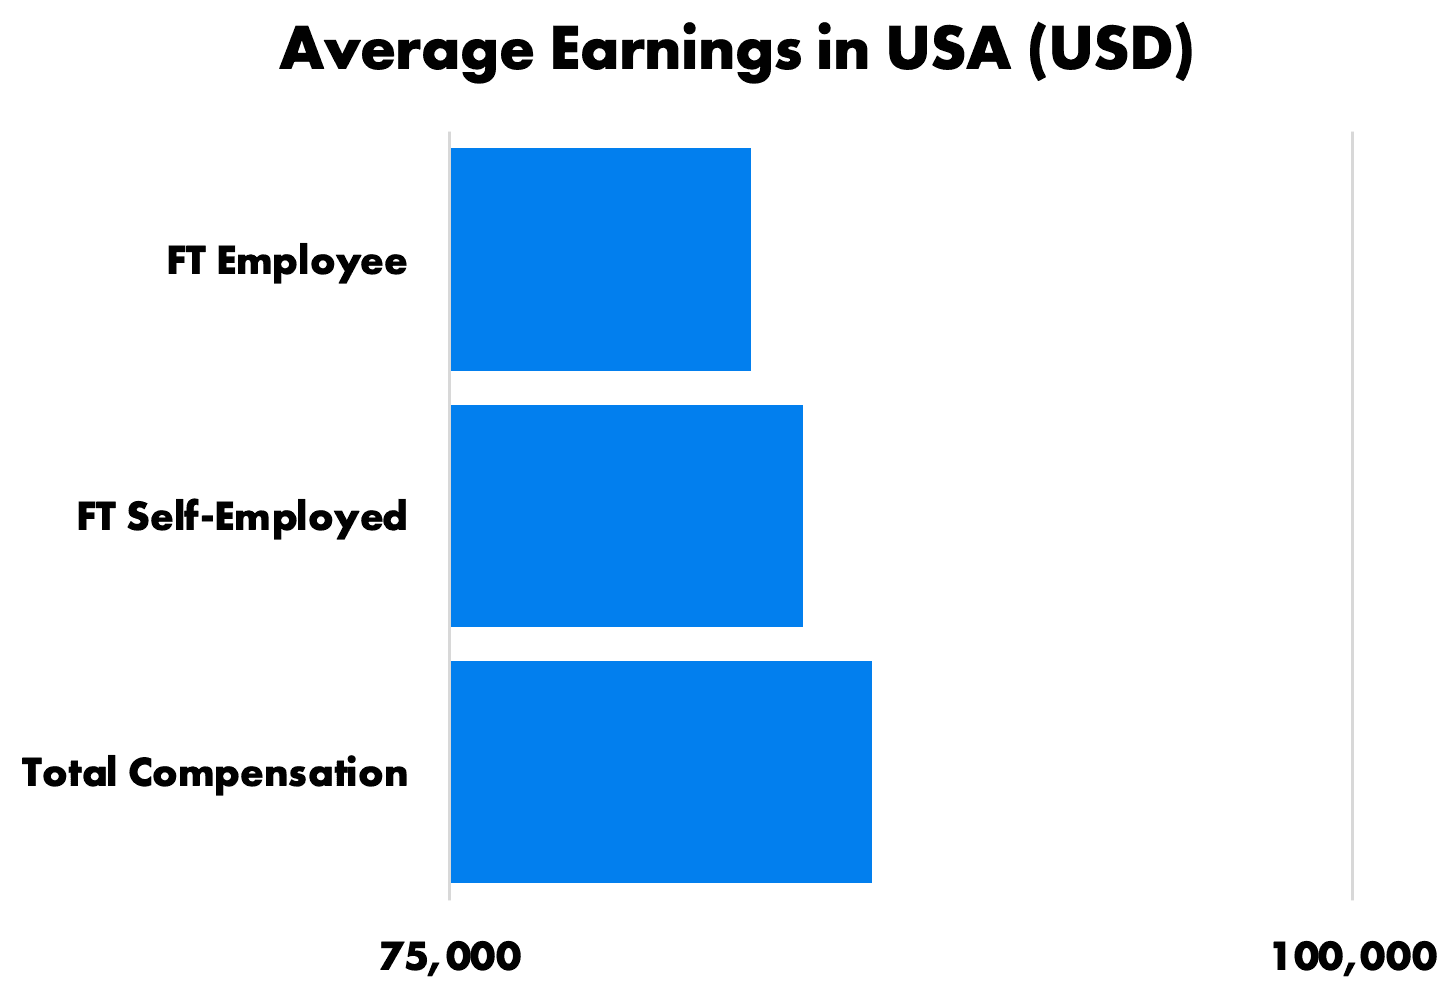
The overall averages for respondents in the US are as follows:
- Full-time employee earnings: $83,347 (n=518)
- Full-time self-employed earnings: $84,796 (n=63)
- Total compensation: $86,686 (n=667)
131 of the 667 respondents (20%) in the US are earning $100,000 or more, and 85 of the respondents in the US are earning less than $60,000.
The strongest indicator of earning potential for corporate instructional designers in the United States is years of experience. Respondents with portfolios who are new to the field (0-3 years experience) also earn over 6% more than their peers without portfolios.
Salary by Industry
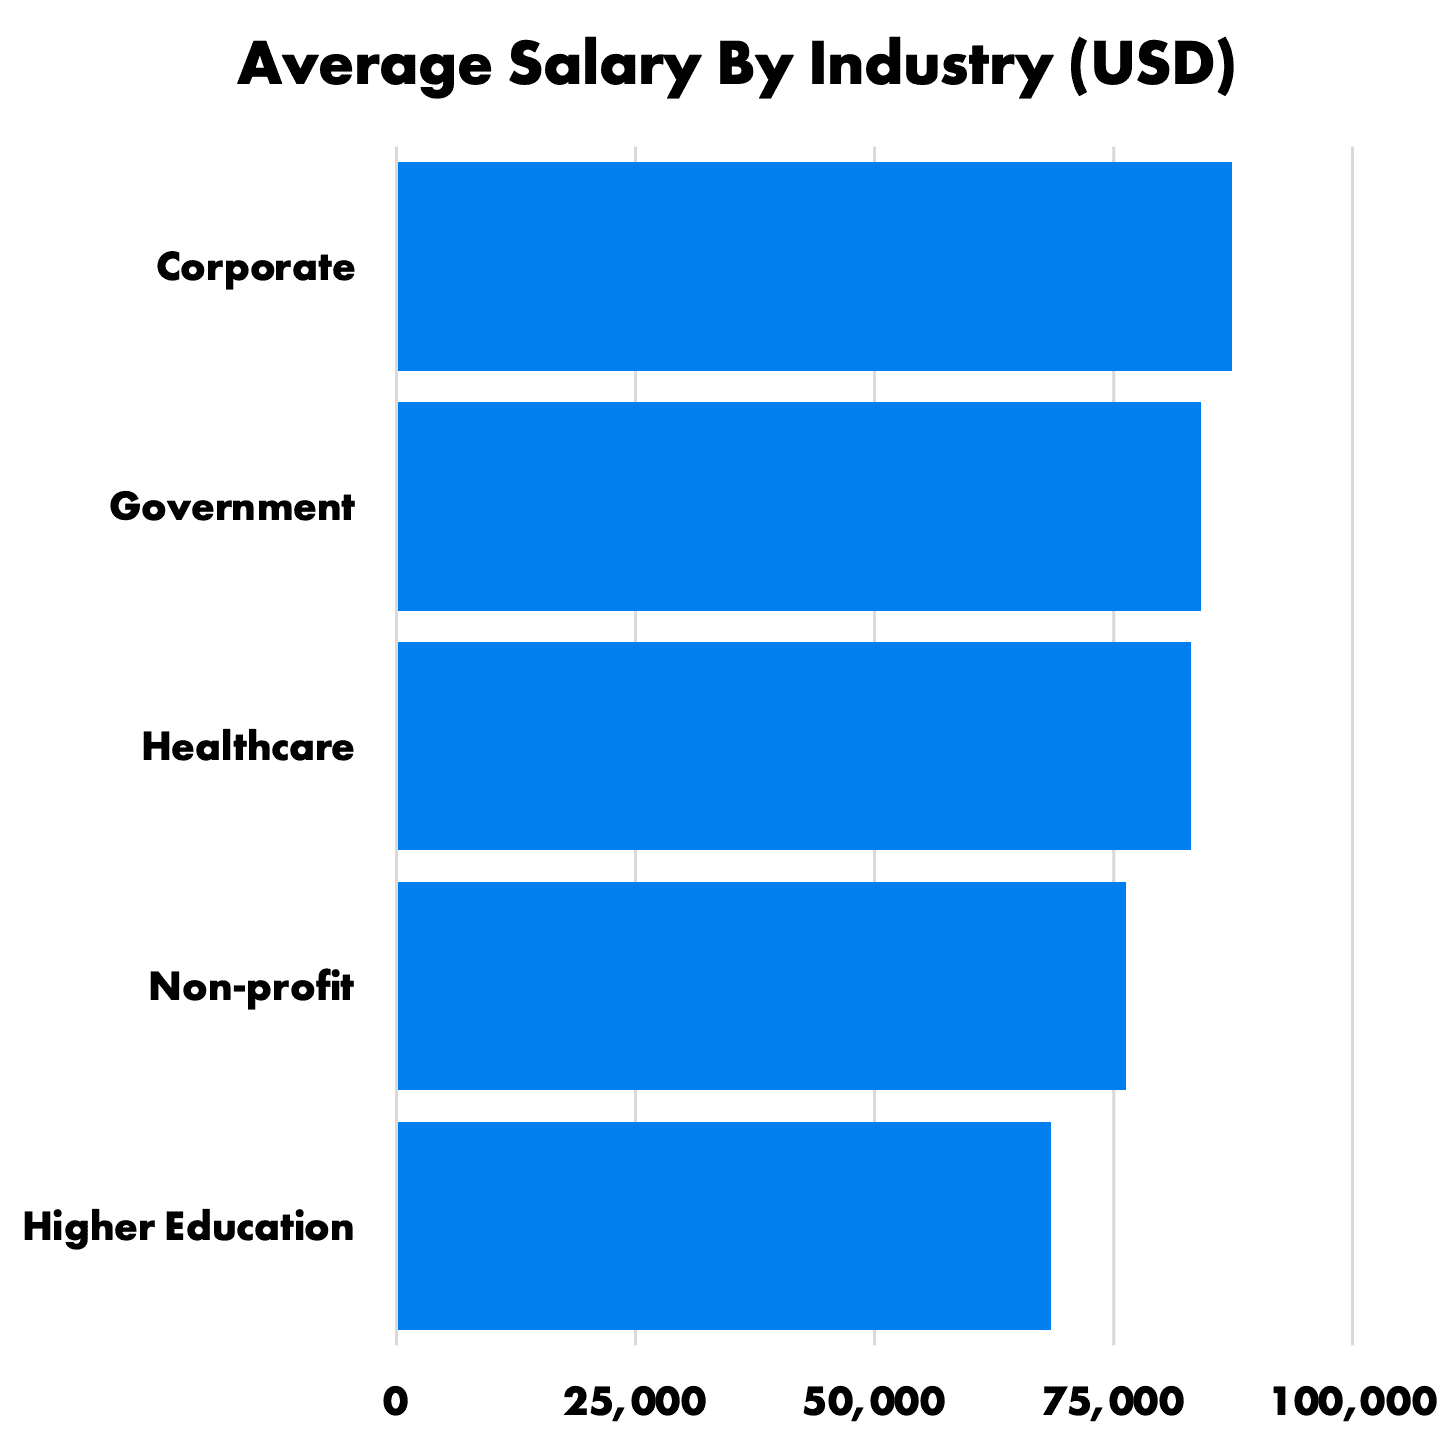
Corporate instructional designers are the highest earners in the industry. Instructional designers who work in higher education earn almost 25% less.
- Corporate $87,384 (n=304)
- Government $84,095 (n=63)
- Healthcare $83,092 (n=58)
- Non-profit $76,335 (n=49)
- Higher education $68,474 (n=44)
Salary by Gender
There is still some salary discrepancy in the instructional design field. Instructional designers who identify as male earn, on average, salaries that are 1.8% higher than female instructional designers.
- Male - $84,462 (n=89)
- Female - $82,924 (n=414)
- Nonbinary - $78,301 (n=6)
Salary by Education
Salaries by education are varied. However, 92% of US respondents with full-time jobs have a bachelor’s or master’s degree, which makes it hard to draw reliable conclusions from the data.
- Some college - $66,607 (n=4)
- Associate degree - $48,022 (n=3)
- Bachelor’s degree - $85,044 (n=122)
- Master’s degree - $83,812 (n=352)
- Doctorate degree - $93,537 (n=29)
- Professional degree - $88,000 (n=5)
That said, the data seems to imply that education doesn’t have a large impact on earning potential as an instructional designer. For further information on what level of education instructional design hiring managers require and prefer for their candidates to have, check out the 2024 Hiring Manager Report.
Salary by Experience
Experience is one of the best indicators for earning potential in full-time positions. Instructional designers tend to earn higher salaries the longer they’ve been in the field.
- 0-3 years $77,856 (n=308)
- 4-8 years $87,809 (n=135)
- 9-15 years $93,046 (n=47)
- 16-20 years $108,214 (n=14)
- 21-25 years $109,750 (n=8)
- 26+ years $95,583 (n=6)
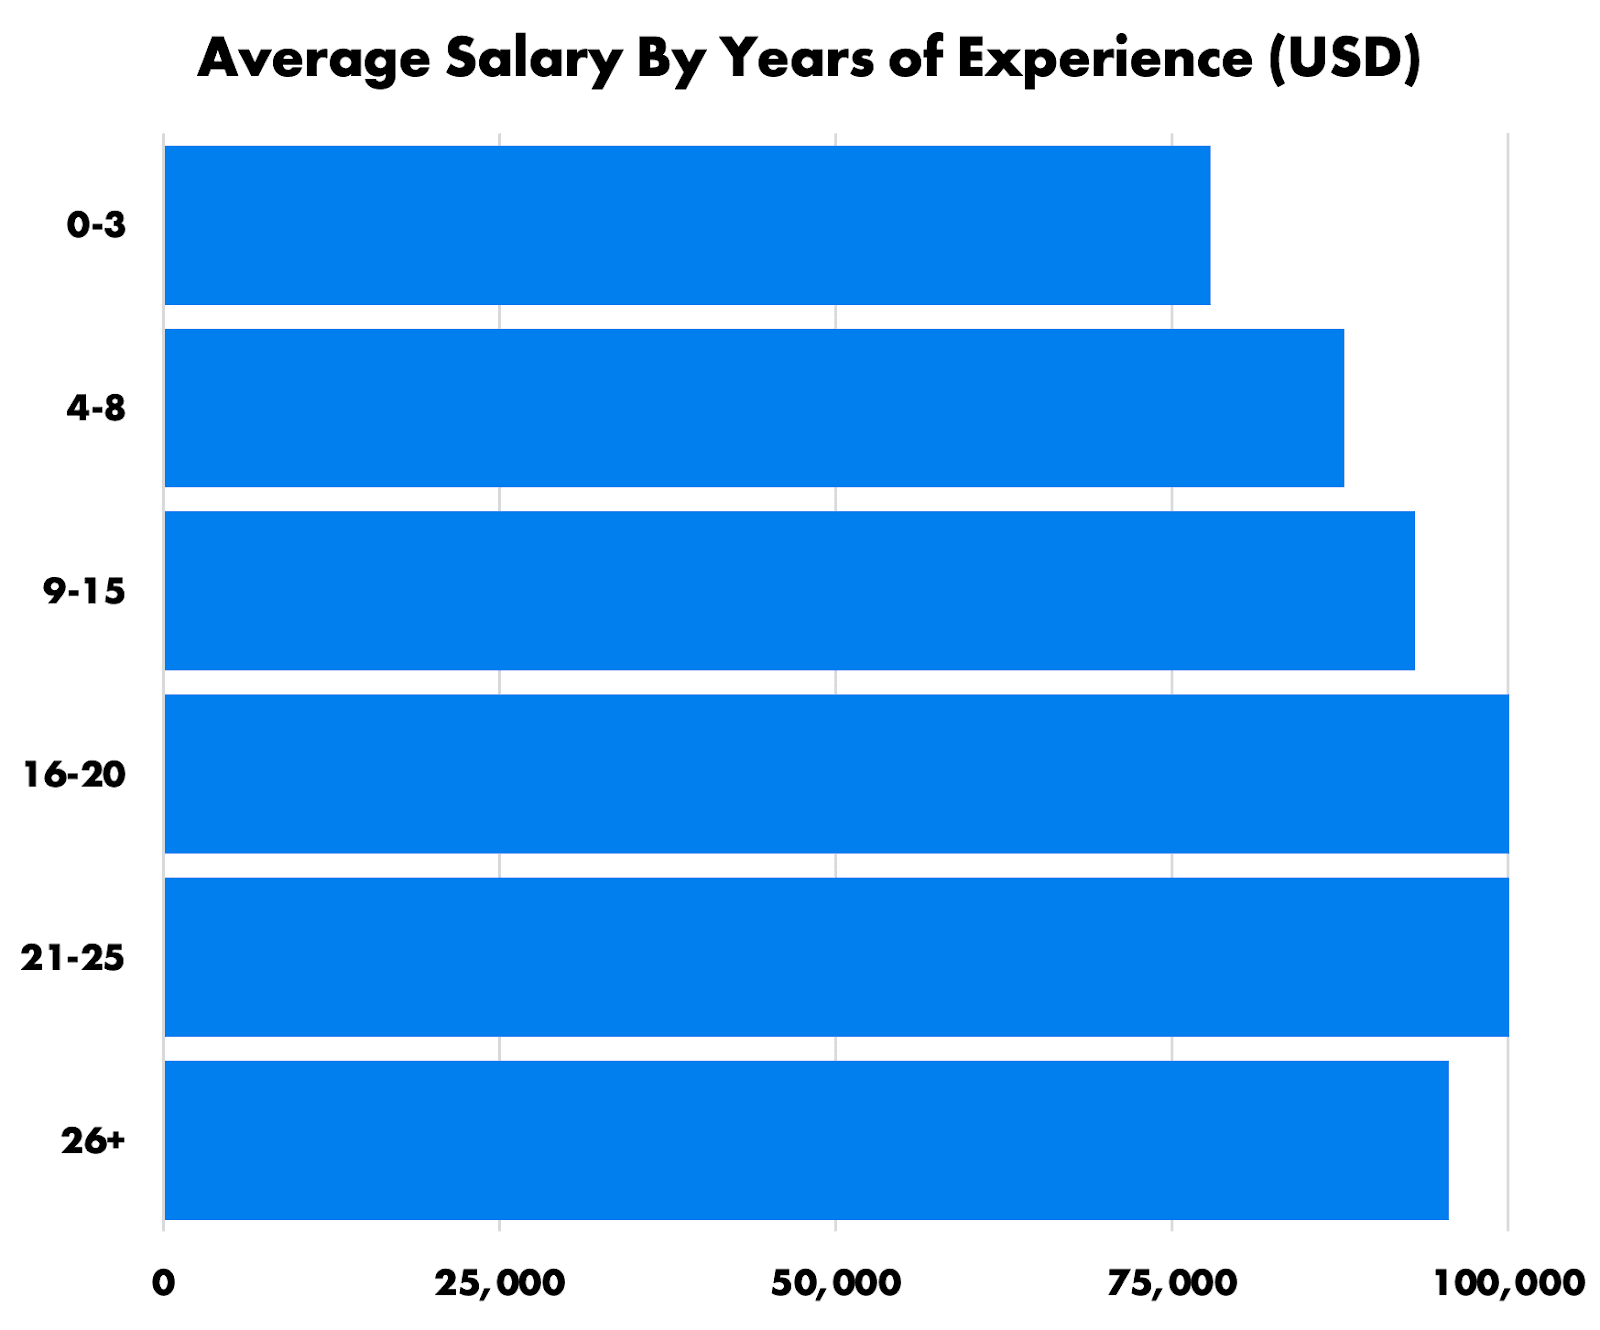
Most notably, there was a 7.8% increase in salary for those with 0-3 years of experience compared to data from three years ago (2021).
Since there are not many respondents with more than 20 years of experience, it is hard to draw any conclusions about why respondents with 16-20 years of experience are earning more, on average, than respondents with more than 20 years of experience.
Salary by Ethnicity
In terms of ethnicity, it seems like Asian / Pacific Islander respondents earn the most with Hispanic or Latino respondents earning the least. This could be due to the sample size of POC respondents, so the data isn’t necessarily conclusive here.
- Asian / Pacific Islander - $84,984 (n=35)
- Black or African American - $83,657 (n=45)
- White - $83,613 (n=357)
- Hispanic or Latino - $79,112 (n=48)
When analyzed through the lens of years of experience, there are no clear patterns or trends to indicate that people of one ethnicity are earning more than people of another ethnicity.
Earnings by Portfolio
Instructional designers earn similar amounts irrespective of if they have a portfolio or not.
- With a portfolio - $82,891 (n=183)
- Without a portfolio - $84,180 (n=335)
But if we look at the respondents’ experience, the data looks very different. Those with more experience are less likely to have a portfolio, but they are earning more because they’ve been in the field for longer.
If we look at instructional designers with 0-3 years of experience in the corporate space, it’s clear that those with a portfolio earn more than those without a portfolio.
- With a portfolio - $83,336 (n=123)
- Without a portfolio - $77,708 (n=54)
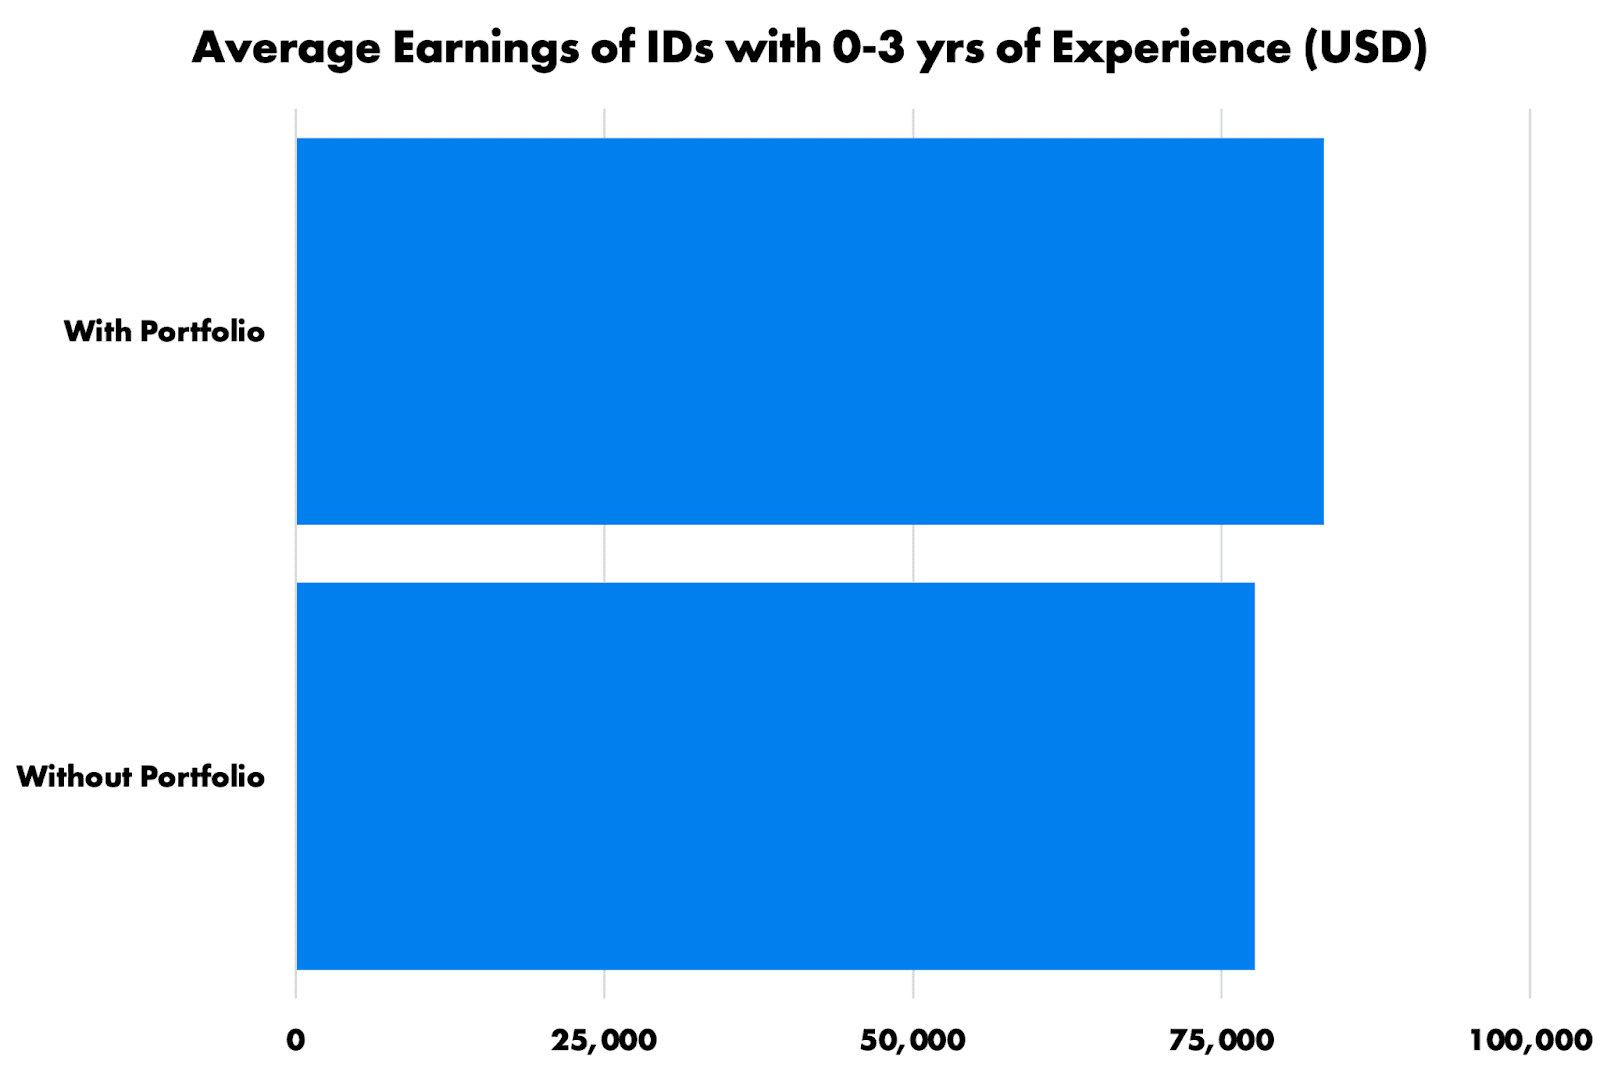
In other words, those with portfolios earn about 7% more than those without.
Either portfolios impact earning potential or those with portfolios who spend time on creating their portfolios also spend time on interview prep, resume improvements, and networking.
What this data could tell us is that it might be getting more difficult to stand out and get paid more without a portfolio when someone is new to the field.
Another interesting finding is that those with a portfolio and a bachelor’s degree earn, on average, $86,433 (n=86), whereas those who don’t have a portfolio but do have a master’s degree earn $86,320 (n=128).
This data indicates that investing time into creating a portfolio may have the same or higher returns than investing time into a formal education program beyond a bachelor’s degree.
Shortcomings
The primary shortcoming with this data is the sample size. Without more responses, it is hard to draw valid conclusions about instructional designer salaries in the USA and beyond.
Furthermore, the primary distribution method for the survey was on LinkedIn. The audience on LinkedIn may be more proactive, since they’re spending their time on a professional social networking platform.
This may indicate that the average salary of instructional designers who are active on LinkedIn is slightly higher than those who are not active on LinkedIn.
I took efforts to combat this by sharing the survey on other platforms where I knew instructional designers were active (YouTube, Instagram, TikTok, etc.), and I asked my audience to share it with their networks on other platforms.
Finally, all of this data is self-reported, so respondents may have reported higher salaries than they actually earn.
Methodology
Most instructional designers who completed this survey are women with master’s degrees working in corporate roles in the United States.
To collect the responses, I distributed the survey on LinkedIn, sent it to my mailing list, shared it in a variety of online instructional design communities, and asked people to share it with their instructional design networks.
The survey ran from July 17th, 2023 to September 26th, 2023. It accrued 1686 responses in total, but after filtering out the responses from managers, aspiring instructional designers, and people who did not complete all of the questions, we were left with 1075 valid responses from individual contributors who do instructional design work.
The respondents live in over 50 different countries, although there are only 8 countries with more than 10 people who responded to the survey.
- United States - 64.2%
- India - 8.8%
- Canada - 6%
- United Kingdom - 3.6%
- Australia - 2.7%
- Germany - 1.1%
- South Africa - 1%
- Poland - 0.9%
- Other - 11.7%
The respondents work mostly in the corporate space, which, for this survey, includes tech, consulting companies, and other for-profit companies that do not fit into the other categories. The industry breakdown is as follows:
- Corporate - 61.6%
- Higher Education - 13.7%
- Healthcare - 9.6%
- Government - 7.4%
- Non-profit - 7.2%
- Other - 0.5%
Most of the respondents are also full-time employees (79%). 10.5% of the respondents work full-time and do client work on the side, and 10% of respondents are full-time freelancers or contractors (self-employed).
Finally, a large portion of the respondents (52%), are newer to the field:
- 0-3 years - 52.8%
- 4-8 years - 29.2%
- 9-15 years - 11.3%
- 16-20 years - 3.8%
- 21-25 years - 1.8%
- 26+ years - 1.1%
So, while we look at a variety of comparisons and statistics, keep in mind that most respondents are full-time employees working corporate jobs in the USA.
Conclusion
Compared to our last industry survey three years ago (2021), instructional design salaries have increased across the board. A substantial 8% increase in earning for those with 0-3 years of experience suggests that entry-level instructional design roles may be offering higher salaries than ever before.
Corporate roles continue to be the highest paying industry in the L&D field, and education level also continues to not be a high indicator of earning potential.
If you’re trying to become an instructional designer, the salary similarities between those with less experience and a portfolio and those with more experience and no portfolio indicate that a portfolio can help you break into the field.
To start on the path of becoming an instructional designer, download the Become an ID checklist.